Contents
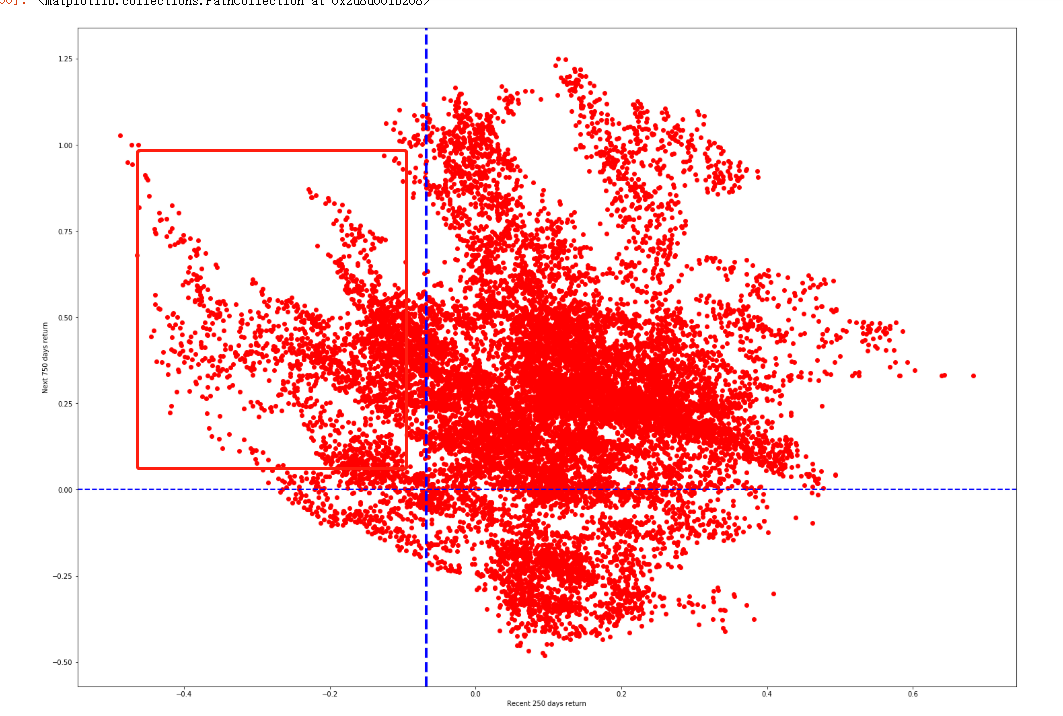
1.最近一年和未来一年的收益情况
check_day_count = 250
next_check_day_count = 250
ret = (np.array(close[check_day_count:]) - np.array(close[:-check_day_count]))/ np.array(close[:-check_day_count])
current_return = ret[-1]
ret = ret[0:-next_check_day_count]
next_year_return = (np.array(close[(check_day_count + next_check_day_count):]) - np.array(close[check_day_count:-next_check_day_count]))/ np.array(close[check_day_count:-next_check_day_count])
plt.figure(figsize=(25, 18))
plt.ylabel('Next %d days return' % next_check_day_count)
plt.xlabel('Recent %d days return' % check_day_count)
plt.axvline(current_return, color="b", linestyle="--",linewidth=4)
plt.axhline(0, color="b", linestyle="--",linewidth=2)
plt.scatter(ret,next_year_return,c = 'r',marker = 'o')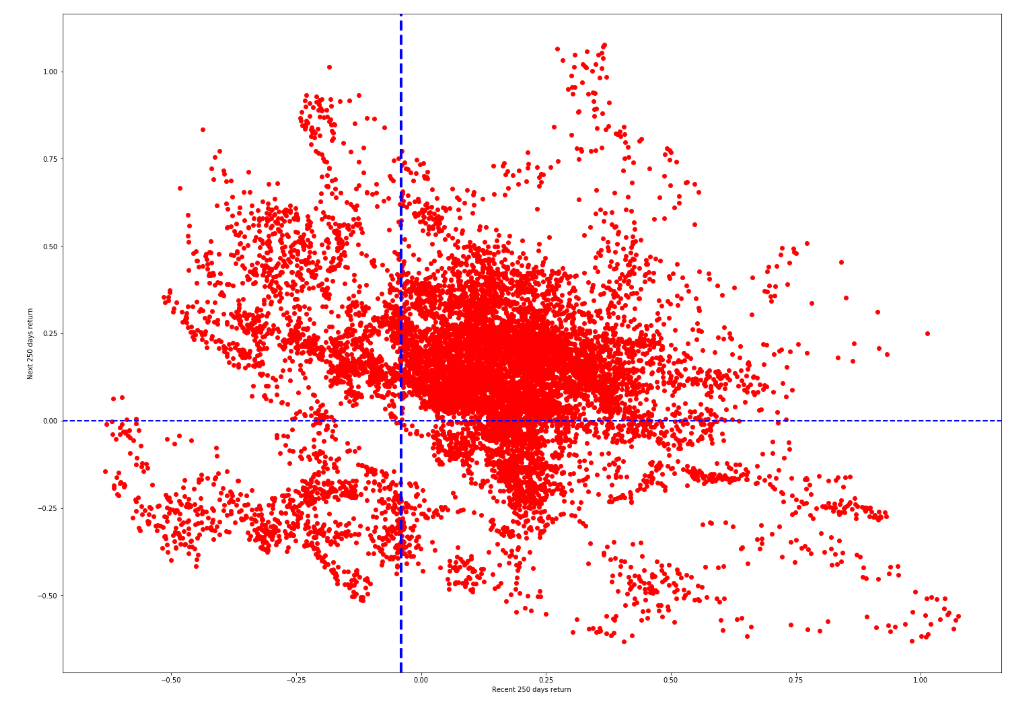
几个结论:
1.1 看红点集中点,整体在右上角的数据多,符合美股过去牛市时间多的特点
1.2 一年上涨超过100%,未来可能会跌50%
1.3 过去一年跌的入场,未来一年也不一定会有正收益,可能是熊市初期
2.最近2年和未来一年的收益情况
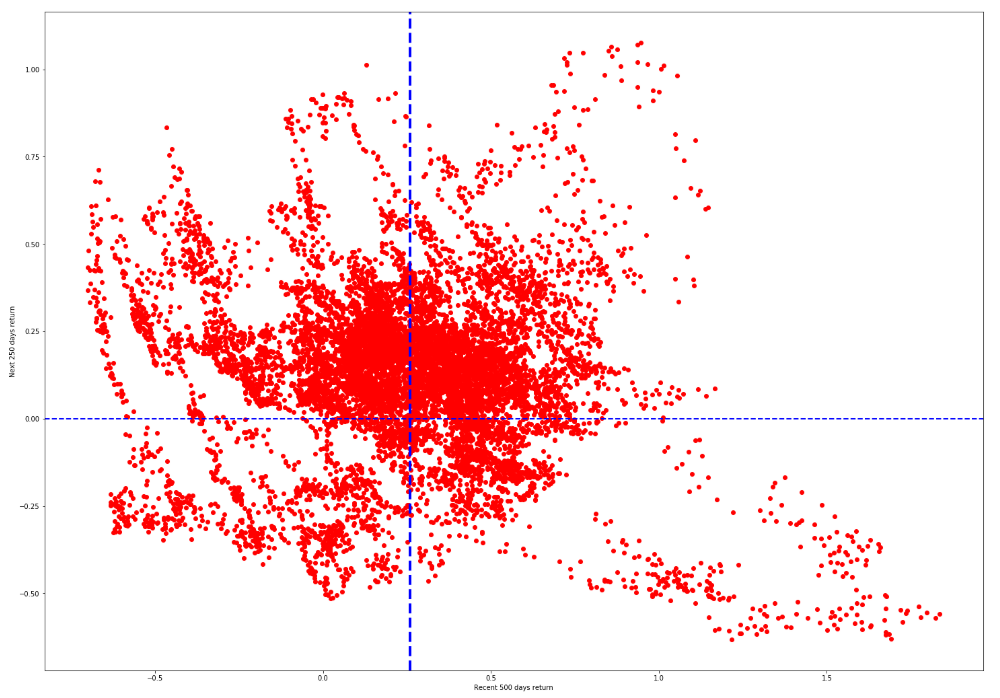
3.最近3年和未来一年的收益情况
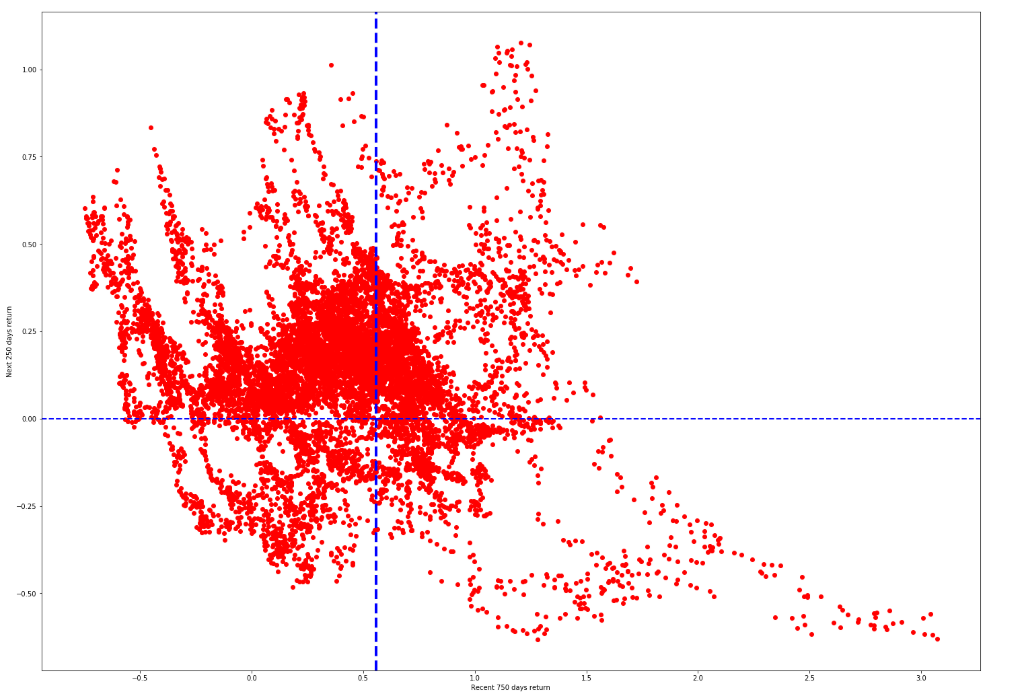
4.最近1年和未来3年的收益情况