import pandas
import matplotlib.pyplot as plt
import numpy as np
import json
from pandas import DataFrame, Series

path = 'ch02/usagov_bitly_data2012-03-16-1331923249.txt'
#从文件中读取
records = [json.loads(line) for line in open(path)]

frame = DataFrame(records)
#对空替换Missing
clean_tz = frame['tz'].fillna('Missing')
#对''用Unknow来替代
clean_tz[clean_tz == ''] = 'Unknown'
#也可以这样写
# clean_tz = clean_tz.apply(lambda x: x if x != '' else 'Unknown')
# value_counts 来返回得到每个计数从大到小排序
tz_counts = clean_tz.value_counts()
print(tz_counts[:10])

#绘制前10, kind 为barh,
tz_counts[:10].plot(kind = 'barh', rot = 0)
plt.show()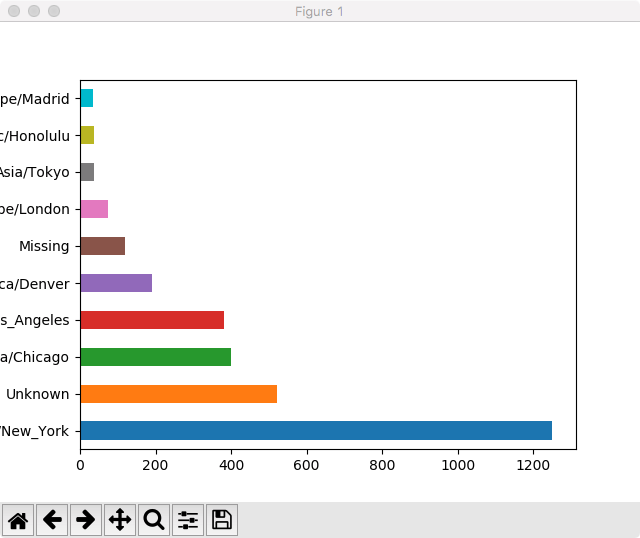
http://www.waitingfy.com/archives/3946
Post Views: 0
3946
pandas, Python | | | Trackback |