import itertools

import numpy as np
import matplotlib.pyplot as plt
from sklearn.cluster import KMeans


np.random.seed(1)

# Set the number of samples, the means and
# variances of each of the three simulated clusters
samples = 100
mu = [(7, 5), (8, 12), (1, 10)]
cov = [
    [[0.5, 0], [0, 1.0]],
    [[2.0, 0], [0, 3.5]],
    [[3, 0], [0, 5]],
]


# Generate a list of the 2D cluster points
norm_dists = [
    np.random.multivariate_normal(m, c, samples)
    for m, c in zip(mu, cov)
]
X = np.array(list(itertools.chain(*norm_dists)))

# Apply the K-Means Algorithm for k=3, which is
# equal to the number of true Gaussian clusters
km3 = KMeans(n_clusters=3)
km3.fit(X)
km3_labels = km3.labels_

# Apply the K-Means Algorithm for k=4, which is
# larger than the number of true Gaussian clusters
km4 = KMeans(n_clusters=4)
km4.fit(X)
km4_labels = km4.labels_

# Create a subplot comparing k=3 and k=4
# for the K-Means Algorithm
fig, (ax1, ax2) = plt.subplots(1, 2, figsize=(14,6))
ax1.scatter(X[:, 0], X[:, 1], c=km3_labels.astype(np.float))
ax1.set_xlabel("$x_1$")
ax1.set_ylabel("$x_2$")
ax1.set_title("K-Means with $k=3$")
ax2.scatter(X[:, 0], X[:, 1], c=km4_labels.astype(np.float))
ax2.set_xlabel("$x_1$")
ax2.set_ylabel("$x_2$")
ax2.set_title("K-Means with $k=4$")
plt.show()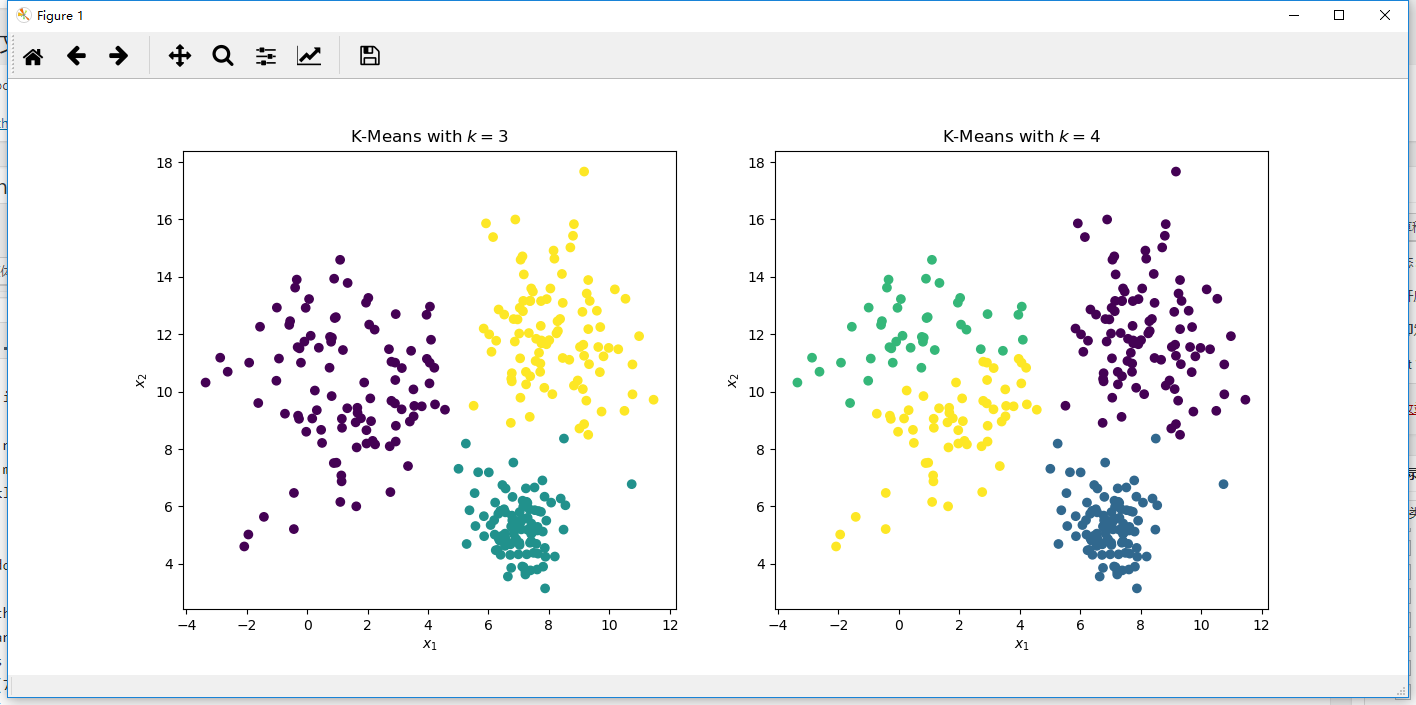
http://www.waitingfy.com/archives/5030
Post Views: 3
5030
sklearn | | | Trackback |