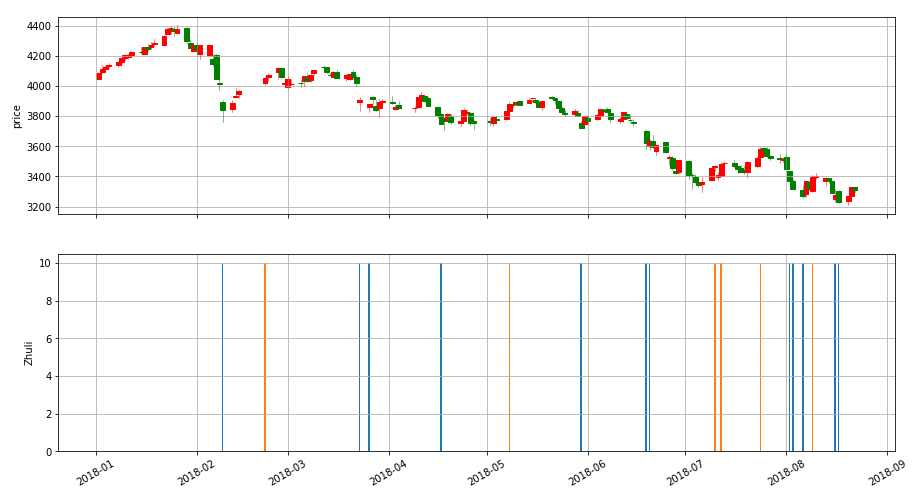
import mpl_finance as mpf
fig, (ax1, ax2) = plt.subplots(2, sharex=True, figsize=(15,8))
mpf.candlestick_ohlc(ax1,daysreshape.values,width=1.5,colorup='r',colordown='green')
ax1.set_ylabel("price")
# plt.grid()
ax1.xaxis_date()
ax1.autoscale_view()
ax1.grid(True)
plt.bar(v_date, v_zhuli, width= 0.5)
plt.bar(v_date1, v_zhuli1, width= 0.5)
ax2.set_ylabel('Zhuli')
ax2.grid(True)
plt.setp(plt.gca().get_xticklabels(),rotation=30)
df['DateTime']=mdates.date2num(df['date'].astype(dt.date))
datetimec = df['DateTime']
df.drop('date', axis=1, inplace = True)
df.insert(0, 'date', datetimec)
df.drop('DateTime', axis=1, inplace = True)
df.columns = ['t','open', 'high', 'low', 'close']
daysreshape = df.reindex(columns=['t','open','high','low','close'])daysreshape 是个dataframe, 列要是t,open,high,low,close